
Chasing the lowest unit price and cheapest shipping feels smart, right? But this focus on saving cents often costs you dollars, silently eating into your profits and tying up your cash.
The fastest way to increase your annual profit isn't always by raising your margin per unit, but by increasing how many times you can sell your inventory in a year[^1]. Faster shipping directly boosts this turnover rate, often making it more profitable than slow, cheap sea freight.
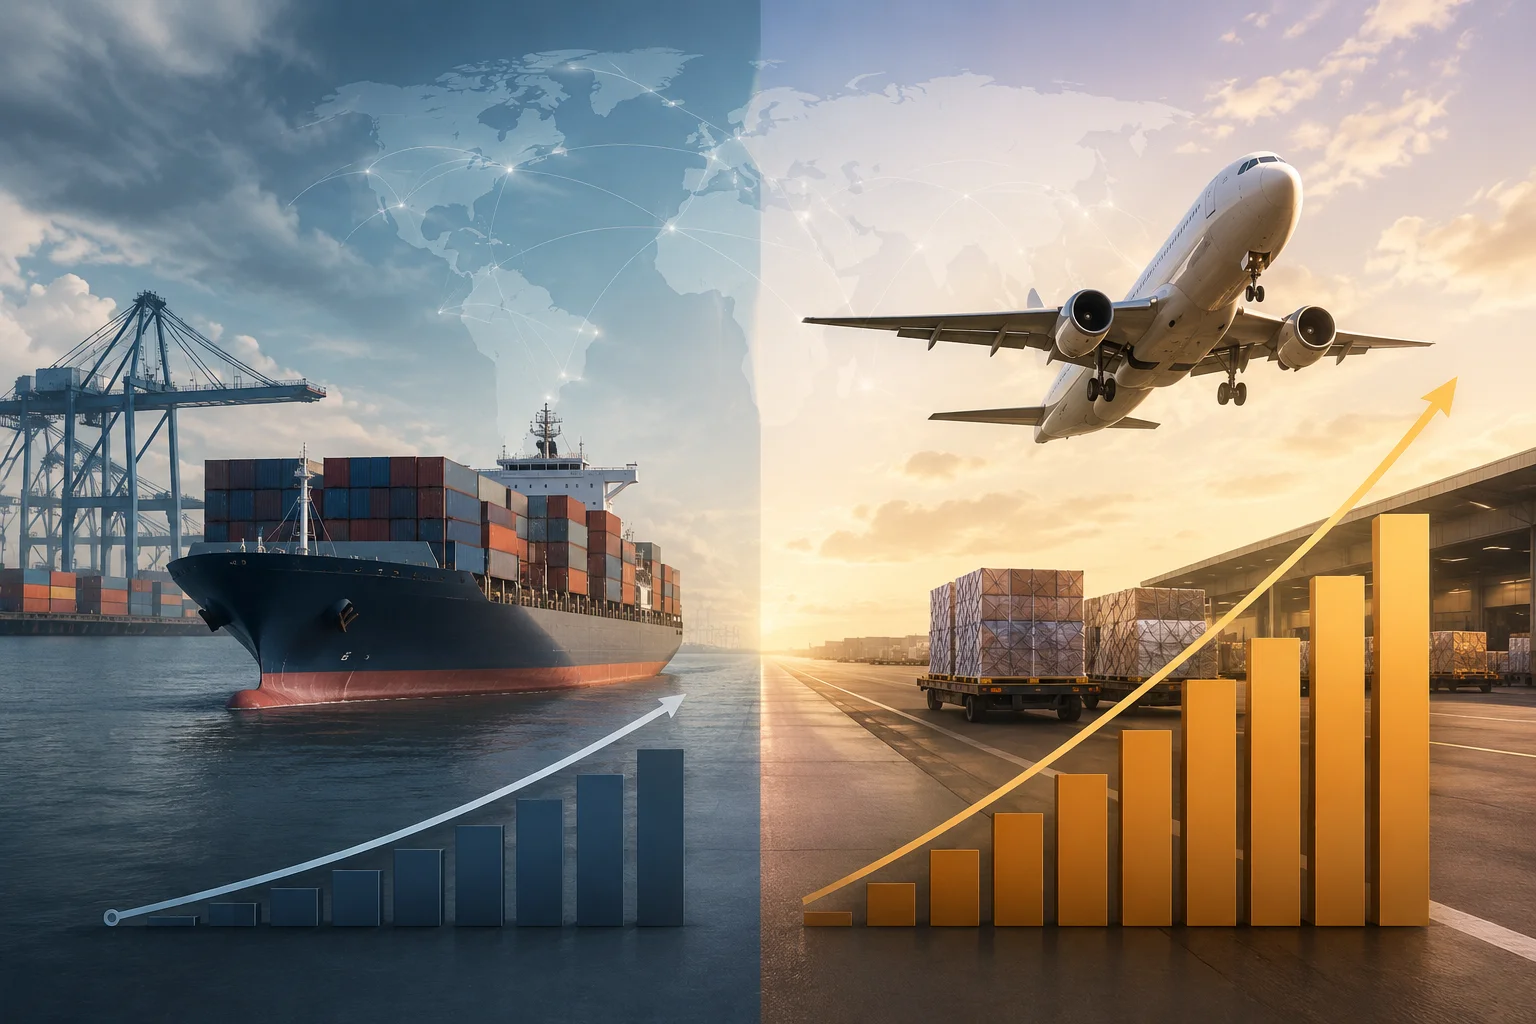
This idea might sound strange at first. I talk to buyers every day, and most of them are laser-focused on negotiating a few cents off the unit price or finding the absolute cheapest freight quote. I get it. I've been exporting electronics from Shenzhen for over 15 years, and every penny counts. But I've also seen businesses get trapped by this thinking. They "save" a thousand dollars on shipping only to lose ten thousand in sales because their products were stuck on a boat for two months. Let's break down how this actually works and why speed is one of the most underrated levers for profitability in this business.
How Does Slow Shipping Quietly Destroy Profit Margins?
You chose sea freight to save on costs, which looked great on the invoice. But now your capital is locked up for months on the ocean, while your competitors are already restocking.
Slow shipping destroys margins by killing your capital turnover. A two-month sea journey means your money is stuck. You can only reinvest your capital maybe 5-6 times a year[^2]. Faster shipping could let you reinvest 12, 20, or even more times, compounding your profits.
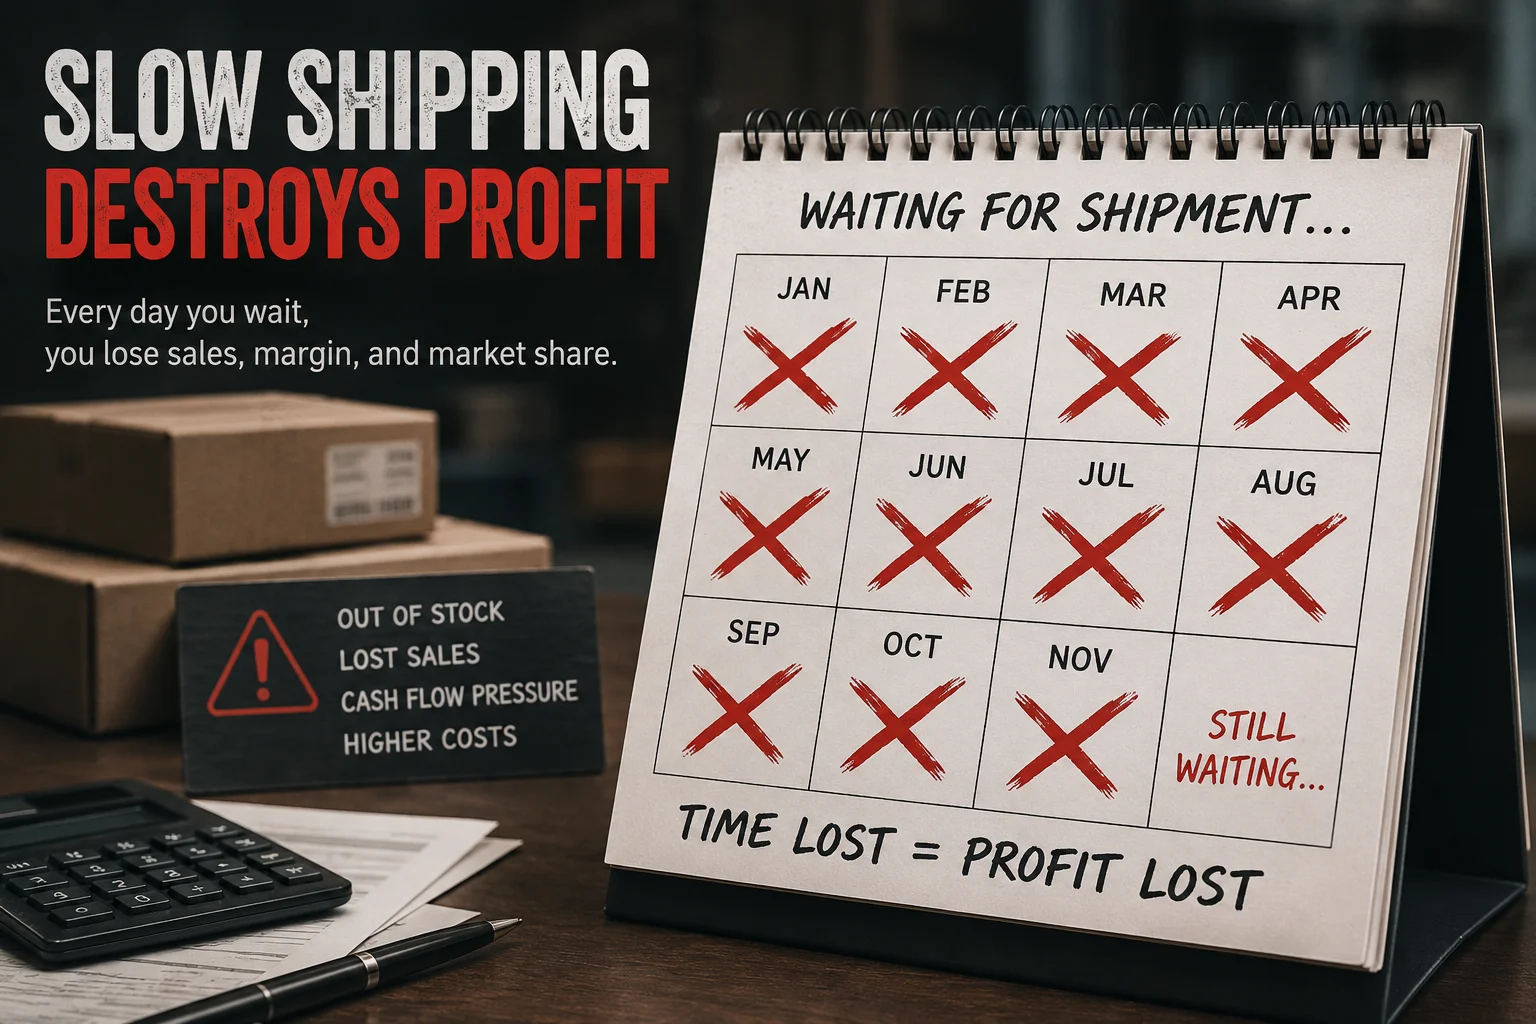
A common mistake I see new importers make is viewing profit as a one-time event. They calculate: (Sale Price - Landed Cost) = Profit. But the real game is about how many times you can make that profit with the same pot of money in a year. The essence of business is the speed of your money's circulation[^3].
Think about it this way. Let's say you have $10,000 to invest in inventory.
The True Cost of Slow vs. Fast
| Metric | Scenario A: Slow Sea Freight | Scenario B: Fast Air Freight |
|---|---|---|
| Transit Time | 60 days | 10 days |
| Profit Margin/Order | 40% (Higher due to low shipping cost) | 20% (Lower due to high shipping cost) |
| Capital Turnovers/Year | Approx. 4 times (every 90 days) | Approx. 12 times (every 30 days) |
| Annual Return on $10k | $10,000 40% 4 = $16,000 | $10,000 20% 12 = $24,000 |
As you can see, even though you make half the profit on each order with faster shipping, you make far more money over the year. Your annual return is 50% higher![^4] This is the core principle that many buyers miss. They win the battle on unit price but lose the war on annual profit. Your money is only working for you when it's moving, not when it's sitting on a ship in the middle of the ocean.
How Does Faster Delivery Improve Capital Turnover?
Is your money always locked in inventory, either in transit or sitting on shelves? This slow cash flow makes it impossible to grow your business or jump on new, hot-selling products.
Faster delivery directly speeds up your cash conversion cycle[^5]. When your smartwatches or TWS earbuds arrive in days instead of months, you sell them, get your money back, and place the next order much sooner. This cycle repeats more often, multiplying your annual return.
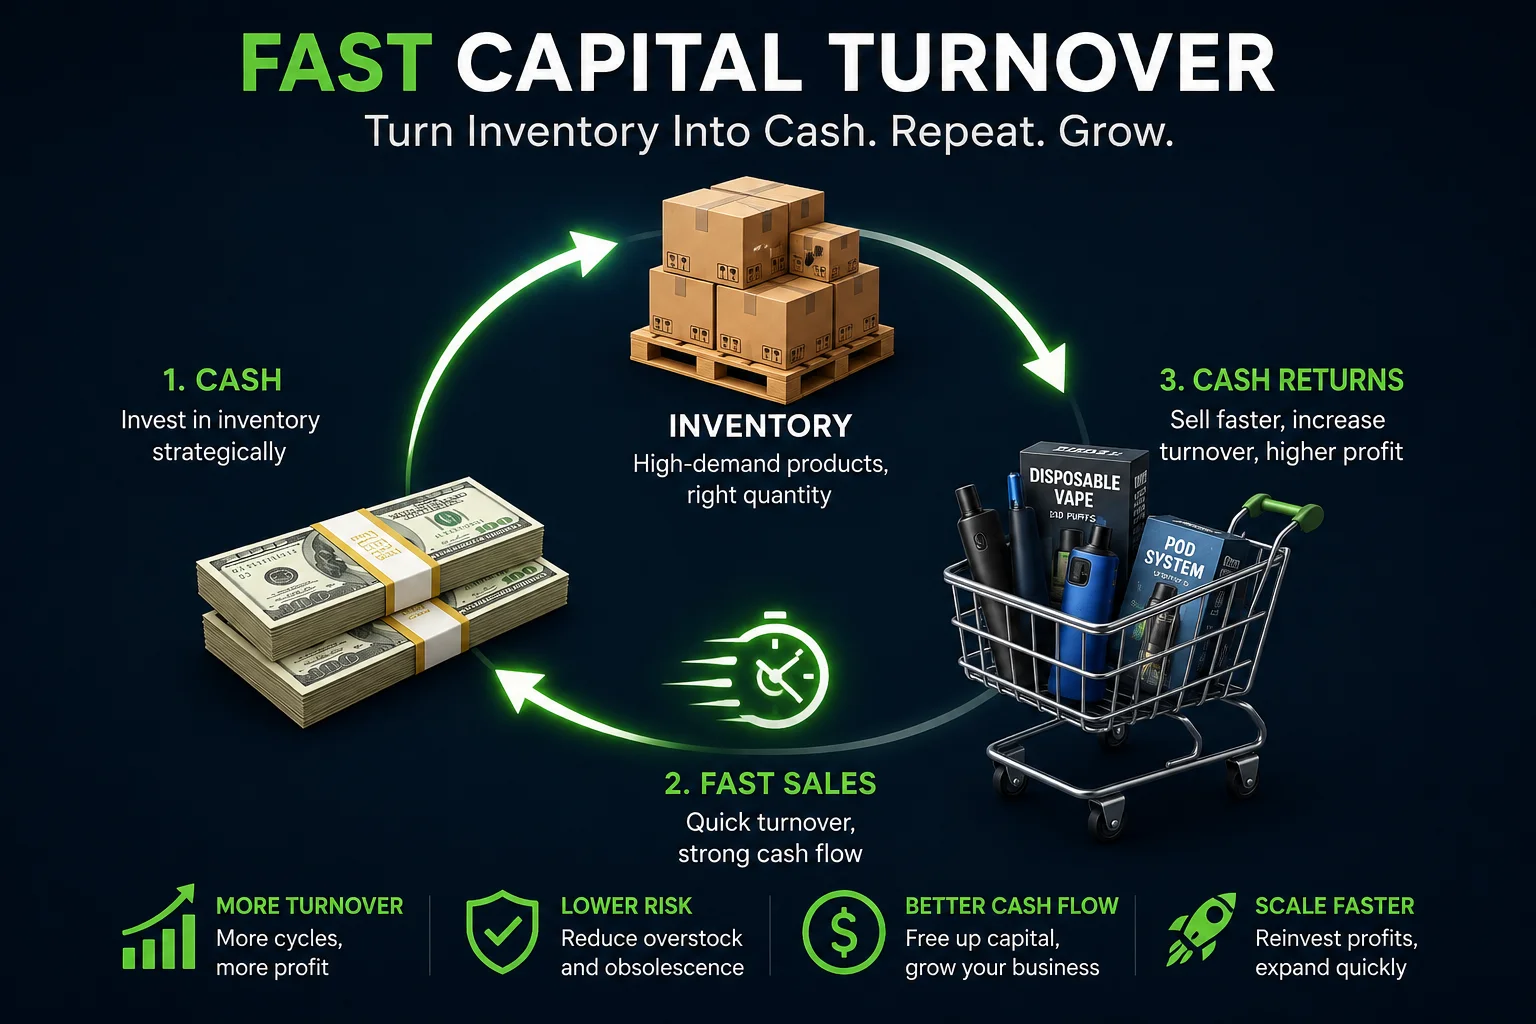
Let’s dive deeper into what this really means. The "cash conversion cycle" is simply the time it takes for you to turn the money you invested in products back into cash in your hand.
It looks like this:
- Invest Cash: You pay us for an order of GaN chargers.
- Goods in Transit: The chargers are shipped.
- Goods in Stock: The chargers arrive at your warehouse.
- Sell Goods: You sell them to your customers.
- Collect Cash: You get paid.
The longest and most painful part of this cycle for an importer is often step #2, "Goods in Transit." Air freight or express shipping can shrink this step from 60 days to just 7-10 days[^6]. This has a massive impact. I worked with an e-commerce seller in Germany who was obsessed with sea freight for his USB cables. His first order took two months to arrive. By the time he finally sold out and was ready to reorder, we had already shipped three separate air freight orders to his competitor. His competitor was always in stock, captured more sales, and dominated the online listings, all because his cash wasn't stuck on a boat.
How Do Shipping Delays Increase Your Inventory Risk?
Your products are finally on their way, but they are stuck on a ship for two long months. The problem is, by the time they arrive, the market may have already moved on.
Long shipping times mean your inventory is aging while in transit. For fast-moving electronics like TWS earbuds or smartwatches, a two-month delay can mean you're arriving with an outdated product[^7]. This massively increases your risk of needing markdowns, clearance sales, or worse, dead stock[^8].

The consumer electronics world moves incredibly fast. A new feature, a better battery, or a sleeker design can appear on the market in a matter of weeks[^9]. Choosing slow shipping is like making a bet that the world will stand still for two months. It's a huge gamble.
I often tell my clients: buying products that will take months to arrive is like buying a two-month-old newspaper. The information is stale. In our industry, a two-month-old smartwatch model can feel just as stale to a customer. This creates several risks that aren't on your initial invoice.
The Hidden Risks of Waiting
| Risk Factor | Impact on Slow-Shipped Goods (2-3 months transit) | Impact on Fast-Shipped Goods (1-2 weeks transit) |
|---|---|---|
| New Tech Release | High. Your product is outdated before it even sells. | Low. You can quickly order the new, updated model. |
| Market Trend Change | High. The color or style is no longer popular. | Low. You can adapt and order what's currently hot. |
| Competitor's Promotion | High. You arrive just as your competitor starts a huge sale. | Low. You have more flexibility to react with your own pricing. |
| Holding & Storage Costs[^10] | High. You pay to store goods for longer before they sell. | Low. Inventory moves quickly, reducing storage needs. |
By choosing faster shipping, you're not just buying speed; you're buying flexibility and reducing the risk of holding worthless inventory.
Why Does Shipping Efficiency Matter More Than Unit Price?
You spent weeks negotiating hard to save $0.10 per unit on your latest order. But then a two-week shipping delay cost you an entire month of peak sales season. Sound familiar?
Focusing only on the unit price is a classic trap. A slightly more expensive product that arrives quickly, sells fast, and allows you to reorder immediately is far more profitable in the long run. The total speed of your supply chain is what truly determines your success.
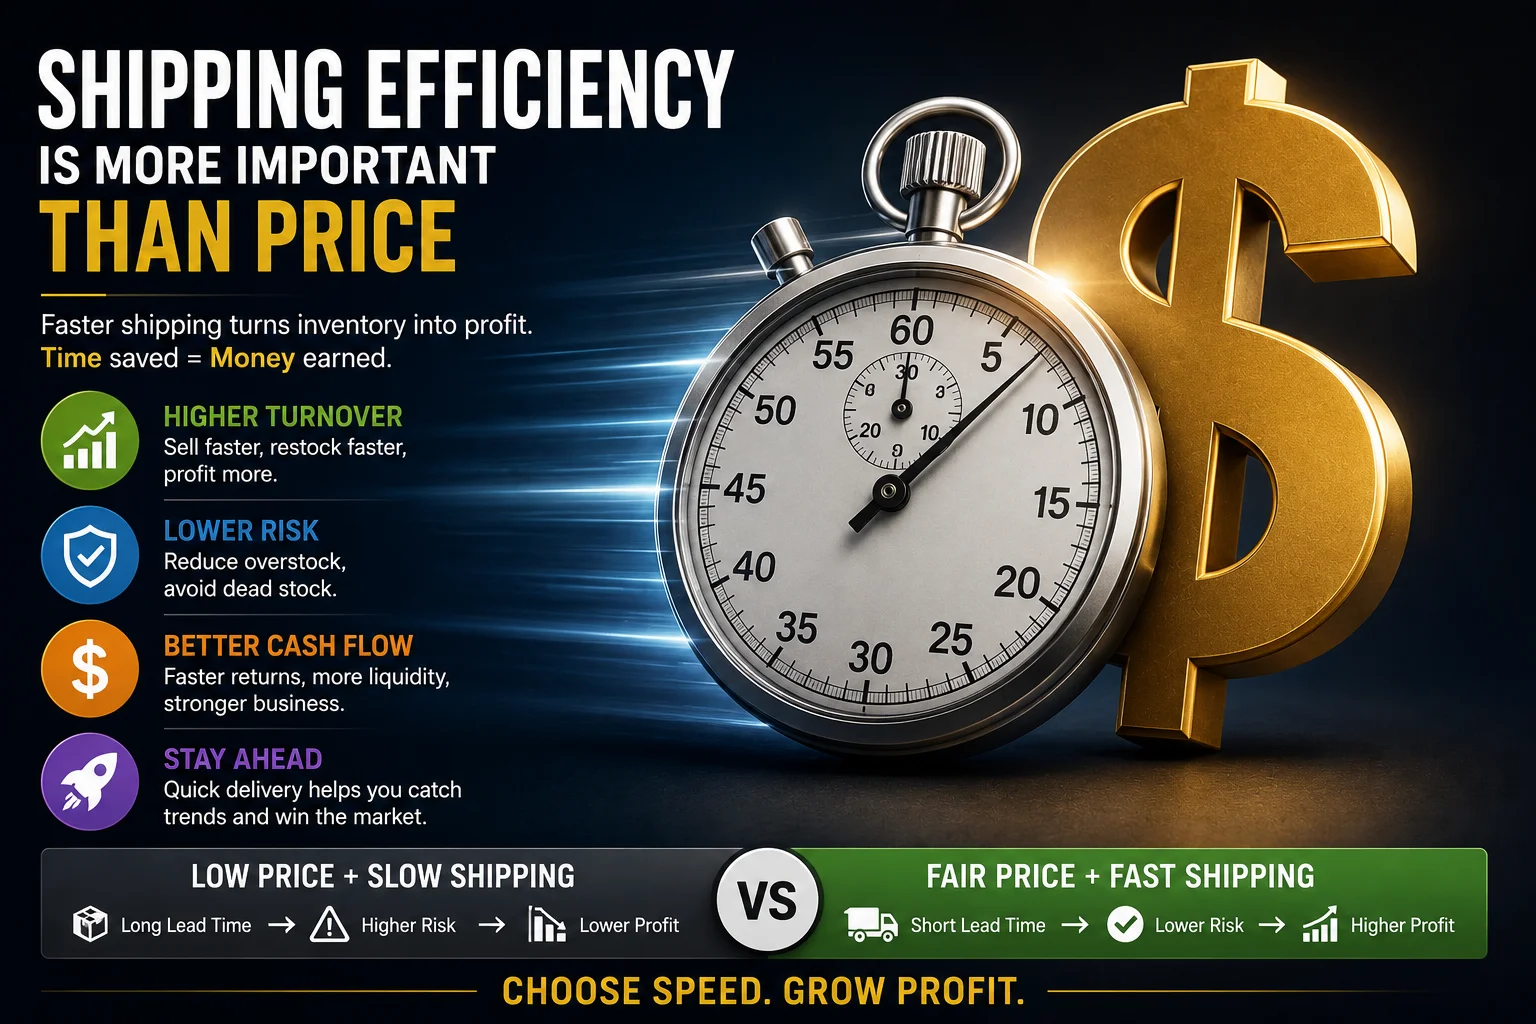
After 15 years of helping buyers source products, I can tell you that the most successful ones don't just calculate their "landed cost." They calculate their "landed speed." They understand that time itself is a component of cost.
I always advise my clients, especially those selling on fast-paced platforms like Amazon, to think about their "profit per day[^11]" instead of just "profit per unit."
Let’s look at a simple example:
- Product A: You make $2.00 profit per unit. It takes 90 days from when you pay to when you sell it and get your cash back (using sea freight). Your profit per day on that capital is $2.00 / 90 days = $0.022 per day.
- Product B: You make $1.50 profit per unit. It takes 30 days from payment to cash-in-hand (using air freight). Your profit per day is $1.50 / 30 days = $0.050 per day.
From a capital efficiency perspective, Product B is more than twice as profitable! It allows you to put your money to work faster and more often. This is the mindset shift that separates amateur importers from professional, scalable businesses. Reliable, fast shipping also builds trust with your customers because you are always in stock[^12]. You're not the seller who is "out of stock" for weeks at a time. This reliability is a brand asset that is hard to put a price on.
Conclusion
Stop focusing only on the unit price. Start thinking about your business in terms of speed and turnover. Faster shipping isn't a cost; it's an investment in profitability and reduced risk.
[^1]: "How Inventory Turnover Affects Business Profitability: Key Insights", https://www.versaclouderp.com/blog/how-inventory-turnover-affects-business-profitability-key-insights/. A source can define inventory turnover as a key financial ratio that measures how many times a company has sold and replaced inventory during a given period, noting that a higher turnover rate is often indicative of greater efficiency and profitability. Evidence role: definition; source type: encyclopedia. Supports: The source should define inventory turnover and explain its direct relationship to a company's profitability and efficiency in generating revenue from its assets.. [^2]: "Shipping From China to US [Updated May 2026 ] | Freightos", https://www.freightos.com/shipping-routes/shipping-from-china-to-the-united-states/. A source can provide data on average end-to-end logistics timelines for sea freight, which typically range from 45 to 70 days or more, supporting the premise that such long cycles limit the number of times capital can be turned over in a year. Evidence role: statistic; source type: research. Supports: The source should provide data on the average total lead time for international sea freight, including transit, customs, and drayage, which would allow for a more accurate calculation of potential annual inventory turns.. Scope note: The source will provide average times, which can vary significantly based on route, season, and port congestion, so the '5-6 times' figure remains an estimate. [^3]: "Velocity of money - Wikipedia", https://en.wikipedia.org/wiki/Velocity_of_money. A source can explain the concept of capital velocity, which measures the efficiency with which capital is used to generate revenue. A higher velocity indicates that money is circulating more quickly through the business, enabling more frequent profit generation from the same capital base. Evidence role: definition; source type: education. Supports: The source should define the concept of capital velocity or the rate of capital turnover and explain its importance in generating profits and driving economic growth.. [^4]: "Air Freight vs Sea Freight: From Cost to Carbon Footprint", https://www.magellanlogistics.com.au/air-freight-vs-sea-freight/. A case study or supply chain model can demonstrate that despite higher per-shipment costs, using air freight can lead to greater annual profitability by increasing inventory turnover and reducing the total cash conversion cycle, thus validating the principle illustrated in the table. Evidence role: case_reference; source type: paper. Supports: The source should be a case study or financial model that compares the total annual profitability of using fast (air) versus slow (sea) shipping, demonstrating how increased turnover can offset higher freight costs.. Scope note: The exact figures in any case study will be specific to that business's products, margins, and market, serving as a proof of concept rather than a universal guarantee of a 50% increase. [^5]: "Word of the Week: Cash Conversion Cycle | HBS Online", https://online.hbs.edu/blog/post/word-of-the-week-cash-conversion-cycle. A source can define the Cash Conversion Cycle (CCC) as a key metric used to assess the efficiency of a company's management of its working capital. A shorter CCC indicates that a company has cash on hand more quickly to reinvest or pay obligations. Evidence role: definition; source type: encyclopedia. Supports: The source should define the Cash Conversion Cycle (CCC) and its components (Days Inventory Outstanding, Days Sales Outstanding, Days Payable Outstanding), explaining it as a metric for how long cash is tied up in inventory and other operations.. [^6]: "Latest Supply Chain and Freight Indicators", https://www.bts.gov/freight-indicators. Data from logistics providers or industry reports can confirm that standard sea freight transit times between Asia and Western markets often exceed 45-60 days, while express air freight can reduce this to approximately 7-10 days, supporting the timeframes given. Evidence role: statistic; source type: institution. Supports: The source should provide data on typical door-to-door transit times for international air and sea freight between major trade lanes, such as Asia to North America or Europe.. Scope note: Actual transit times are subject to significant variation due to factors like port of origin/destination, customs clearance, and carrier service levels. [^7]: "The Lifecycle of a Tech Product | Capitol Technology University", https://www.captechu.edu/blog/lifecycle-of-tech-product. Market analysis or academic research can confirm that the consumer electronics industry is characterized by short product lifecycles and rapid technological obsolescence, where new models with improved features are introduced frequently, making older inventory quickly less desirable. Evidence role: general_support; source type: research. Supports: The source should discuss the rapid pace of innovation and short product lifecycles in the consumer electronics industry.. [^8]: "supply chain risk management (SCRM) - Glossary | CSRC", https://csrc.nist.gov/glossary/term/supply_chain_risk_management. A source from supply chain management can explain that long lead times amplify the 'bullwhip effect' and increase forecast error, raising the probability that inventory will become obsolete due to changes in demand or technology, necessitating costly markdowns or write-offs. Evidence role: mechanism; source type: paper. Supports: The source should explain how long lead times in a supply chain increase the risk of inventory obsolescence, which in turn forces businesses to use markdowns or write off stock, leading to financial losses.. [^9]: "Headphones - Wikipedia", https://en.wikipedia.org/wiki/Headphones. An industry report or market analysis can document the high frequency of product launches in the consumer electronics sector, with some brands releasing new models or variations on a quarterly or even more frequent basis, supporting the claim of rapid market changes. Evidence role: statistic; source type: research. Supports: The source should document the frequency of new product releases or updates in a specific consumer electronics category, such as smartphones or wireless earbuds.. Scope note: While minor updates may be frequent, major technological shifts happen on a slightly longer timescale. [^10]: "Carrying cost - Wikipedia", https://en.wikipedia.org/wiki/Carrying_cost. A source from accounting or logistics can define inventory holding costs as the total expense of holding unsold inventory, which typically includes warehousing fees, insurance, security, taxes, and the opportunity cost of the capital tied up in the goods. Evidence role: definition; source type: education. Supports: The source should define inventory holding costs (or carrying costs) and list their primary components.. [^11]: "Costing systems - Throughput accounting and theory of constraints", https://www.pastpaperhero.com/resources/acca-pm-costing-systems-throughput-accounting-and-theory-of-constraints. A source can describe Throughput Accounting, a management methodology that aligns with the 'profit per day' concept by focusing on maximizing the rate at which a company generates money through sales ('throughput') relative to its constraints and operating expenses. Evidence role: general_support; source type: paper. Supports: The source should explain a formal management accounting concept, like Throughput Accounting, that prioritizes the rate at which a system generates money over traditional unit cost focus.. Scope note: The source will use formal terminology like 'throughput' rather than the colloquial 'profit per day,' but it supports the underlying principle. [^12]: "The Impact of Stockouts on Customer Loyalty to Lean Retailers", https://scholarworks.waldenu.edu/dissertations/1011/. A consumer behavior study can show that out-of-stock events lead to significant customer dissatisfaction, loss of trust, and a high propensity for customers to switch to a competitor, thereby demonstrating that consistent availability is a key driver of customer loyalty. Evidence role: statistic; source type: research. Supports: The source should be a study or survey that quantifies the effect of product stockouts on consumer behavior, including their likelihood to switch brands, lose trust, or not return to a retailer..